
Here is a selection of charts designed to challenge some of the shakier claims about the economic impacts of Brexit, including on the pound, investment, food prices, trade, and overall GDP.
Many newspapers and magazines have published sets of charts to mark the tenth anniversary of the UK’s vote to leave the EU – most carefully curated to show Brexit in the worst possible light. Here’s an alternative set designed to challenge some of the usual narratives about the economic impact. If you don’t like these, I have others!
1. “The vote to leave caused a collapse in the pound”
Sterling did fall sharply in June 2016, but it had already started to weaken in 2015 as a consensus emerged that the currency was overvalued.
This was reflected in the UK’s large current account deficit, which bottomed out at 5.2% of GDP in 2016 but has since roughly halved.
The strong pound had also contributed to three years where inflation was below the official target of 2%, averaging 1.5% in 2014, zero in 2015, and still just 0.7% in 2016. The fall in the pound did then lift inflation, but only to a peak of around 3% in 2017.
Moreover, the dollar-sterling exchange is not necessarily the best measure, because the US currency has been strong across the board.
In trade-weighted terms the fall in the pound between 2015 and 2016 did little more than reverse the rise since 2012. This is even clearer in my alternative chart, which shows the pound against the euro.
In short, at most the leave vote accelerated a fall which was already underway – and this correction was not necessarily a “bad thing”.

2. “Brexit has permanently damaged business investment in the UK”
Nope. UK business investment did underperform the rest of the G7 in the first few years after the vote to leave, partly due to Brexit uncertainty, but it began to recover as soon as this uncertainty eased.
As my chart shows, UK investment is tracking France and Canada again. The laggards are now Germany and Japan; the leaders are Italy (fiscal incentives and EU subsidies) and the US.

In the meantime, “Brexit Britain” continues to score relatively highly in surveys of investment attractiveness (such as this one by EY).
Indeed, UK business investment would probably be doing much better had it not been for non-Brexit headwinds, including relatively high energy costs and Labour’s ongoing assault on business and wealth creation.
(One caveat: the initial hit means that the UK’s *stock* of capital may still be lower than it would otherwise have been, but the *flow* of investment is recovering, and, over time, this should close the gap.)
3. “Brexit has dramatically raised the cost of UK food”
Obvious nonsense.
Any Brexit effects on food prices – both up and down, such as lower UK tariffs on food imported from the rest of the world – have been swamped by global factors.
The chart below shows what has actually happened to food prices in both the UK and the EU, each indexed to their respective levels in 2015.

The big picture is the same regardless of the base year: food prices have risen by similar amounts over every time horizon since the vote to leave.
Ps. this chart shows what has happened to food prices over time, not that food prices are lower in absolute terms in the UK than in the EU. But as it happens, various studies (such as this one from the IGD) have found that UK food is cheaper than the EU average.
Intense competition in the supermarket sector is a key factor (ignore the charlatans and shills claiming that the UK has been “flooded” with cheap, sub-standard food since Brexit, which is another obvious lie).
4. “Brexit Britain’s growth has taken a big hit”
The evidence for this claim is remarkably flimsy.
It is nearly impossible to isolate Brexit’s impact from other factors, such as Covid and the UK’s relatively high energy costs. But studies claiming the UK economy has taken a hit of “as much as 8%” fail to do so miserably.
This chart shows what has actually happened to GDP per head (the least favourable measure for the UK) after the vote to leave the EU and for an equal period beforehand.

Since the Brexit vote, the UK has underperformed the US (where growth has benefited from a large fiscal stimulus, low energy costs, and the AI boom), as well as both Spain and Italy (where growth has been flattered by the rebound from the slump before 2016).
The fairer comparisons are with France, Canada, and Germany. “Brexit Britain” has underperformed France, outperformed Germany, and broadly kept pace with Canada.
In short, there is no sign of a significant Brexit hit here, let alone “8%”.
5. “Brexit has crippled UK exports”
No. In particular, the OBR’s assumption that the UK’s global exports of goods and services would be 15% lower than otherwise has simply not been reflected in the actual data.
It is doubly hard to isolate the impact of Brexit on trade, because the way in which the data is collected has changed. But there are three key takeaways from the chart below (which again shows the least favourable measure for the UK, which in this case is volumes not values).
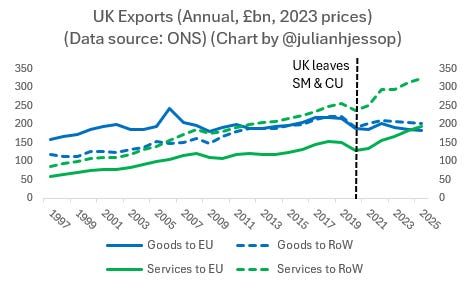
First, exports of goods to the EU have fallen since 2019, but they were never strong in the first place. Indeed, there has essentially been no growth in exports of goods to the EU for decades, even when the UK was a full member of both the Single Market and Customs Union.
Second, exports of goods to the rest of the world have also fallen since 2019, which shows this is not just about Brexit.
Third, exports of services (the UK’s main strength) have continued to boom, with little difference in the trends in exports to the EU and to the rest of the world.
6. “Britain will be a much less open economy, and this will reduce productivity by 4% in the long run”
Again, the data simply do not support this claim.
The OBR had assumed that additional trade barriers would lower the UK’s trade intensity (exports plus imports as a share of GDP) by 15%, relative to remaining in the EU, and that this would reduce productivity by 4%.
But the last time the OBR looked at this (in November 2025) it predicted that the UK’s trade intensity would remain at around 65% at a time when global trade is in retreat. Moreover, the UK’s trade intensity has continued to track that of comparable economies, such as France and Italy.
 and charted by Julian Hess.
AI-generated content may be incorrect.")
You can follow me on X (formerly Twitter) @julianhjessop and on Bluesky.
I also post regularly on Substack
