
How the numbers in the CBI Economics report are being spun to mislead, and why Italy and Spain are not good benchmarks for the performance of ‘Brexit Britain’…
Welcome to the third weekly wrap of key points from my social media posts. These wraps will typically include a mix of comments on the UK and global economies, the markets, and occasionally on politics too, as well as a selection of favourite charts.
Sunday 31 May
I was asked about this chart from David Smith’s column in the Sunday Times. Is this a good way to gauge the economic impact of Brexit? In short, no.

For a start, there are many other factors which might explain why the UK economy appeared to underperform over this period, including bigger hits from Covid and the energy crisis. But Italy and Spain are also poor benchmarks for other reasons.
Italy’s faster growth since 2016 is partly just catch up after the big hit from the euro debt crisis of the early 2010s, as the chart below shows. It has also been flattered by a huge fiscal stimulus. Spain’s strong growth is probably more sustainable, but it comes from a lower base.

This is perhaps clearer still in this alternative version of David Smith’s chart. (My numbers are slightly different, which probably just reflects the different sources and rounding.)
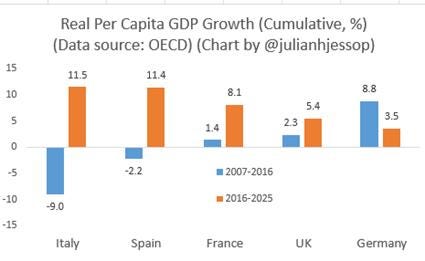
I’ve dropped the euro area, because it doesn’t really add anything except more problems (notably Ireland’s dodgy GDP data, which came up again on Friday). More importantly, I’ve added the previous ten years for comparison.
The key takeaway is that the countries posting the strongest per capita growth over the last decade are those that had done worse over the decade before – and vice versa. Crucially, this has very little do with Brexit.
Monday 1 June
More rail operators were brought back into public ownership following the nationalisation of Thameslink, Southern, Great Northern and Gatwick Express. This prompted Labour’s Al Carns to post “The money you spend on your ticket will now go back into fixing your train. Not a shareholder’s yacht.”
Obviously, the Armed Forces Minister is one of the last people I would want to pick a fight with, given his military background. So, I will just whisper that these nationalisations are not a gamechanger. The train operating companies made tiny profits (2% margins do not buy a lot of yachts), rail infrastructure is already publicly owned (Network Rail), and the more profitable firms that own the trains are still private.
Tuesday 2 June
The Guardian led with “UK’s growing green economy worth more than £100bn a year, research finds“. This cited analysis by CBI Economics, available here, which also claimed that ‘net zero’ activities ‘support’ 1.1 million jobs.
This is guff. The numbers in the CBI report are what they are. But they have been spun by others in misleading ways.
For a start, even on the report’s figures, only £36.7 billion of Gross Value Added (GVA) and 308,000 jobs are directly attributable to ‘net zero’ companies. The rest comes from heroic assumptions about the second round effects on the rest of the economy, driven by the spending by ‘net zero’ companies and by the workers they employ.
This begs the question of why activities which are classified as ‘net zero’ should stimulate the rest of the economy more than those that are not.
For example, the report cites the boost to supply chains from manufacturers of Electric Vehicles. But presumably manufacturers of petrol and diesel vehicles have supply chains too. Indeed, they might be less reliant on batteries imported from China.
The report also compares the wages of ‘net zero’ workers with the average in the economy as a whole, rather than what the same people could earn doing similar activities that are not ‘net zero’, such as workers in the North Sea oil and gas industry, or plumbers and electricians employed in other areas.
Even the numbers for the direct contribution are dodgy. In particular, the headline figures count the cost of government subsidies as a benefit, because they are included in the GVA measure.
Similarly, most of the ‘net zero’ jobs simply reclassify or divert workers from jobs that already exist and many are already relatively highly paid and productive. Measuring the contribution of an industry by the number of people it employs is itself questionable, because tying people up doing one activity rather than another is a cost (or input), not an end (or value added) in itself.
So if the government spent loads more money to employ people to blow on windmills when nature lets us down, the CBI methodology would count this as a big win.
Finally, the fact that ‘green’ GDP is growing relatively quickly matters little if the sector is a drag on the rest of the economy. In particular, the mad rush to ‘net zero’ means UK energy is more expensive and less secure, resulting in job losses in other sectors and undermining growth elsewhere.
In short, if policy-makers want to make a positive case for the ‘net zero’ economy it needs to be based on the environmental benefits, or something else, rather than on what are actually wider economic costs.
Wednesday 3 June
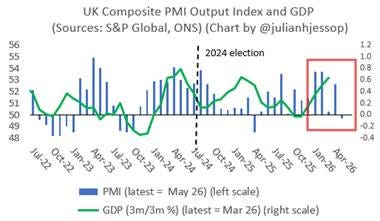
More evidence of the fallout from crisis in the Middle East. The final S&P Global UK PMI Composite Output Index (covering services and manufacturing) came in at 49.7 in May. This was at least an upward revision from the flash estimate of 48.5 but is still consistent with a much weaker second quarter.
Thursday 4 June
The separate S&P Global UK Construction PMI Activity Index slid even further to just 38.2 in May, down from 39.7 in April. Again, the recent slump here is mainly due to the fallout from the Middle East crisis. But the construction sector has been struggling ever since the summer of 2024, reflecting higher costs, increased uncertainty, and more red tape – despite Labour’s promises to “build baby, build”.

Friday 5 June
The Bank of England’s latest Decision Maker Panel survey also showed no sign that the UK labour market is recovering from the shock of Rachel Reeves’ first Budget, with more job losses expected over the coming year.

Finally, new Eurostat figures for Q1 showed once again why you should not compare the performance of the UK economy to euro area or EU aggregates that include Ireland’s infamous GDP data, which are distorted by the activities of multinationals.
The 0.1% q/q fall in EU GDP was dragged down by a 12.1% slump in Ireland (mainly pharma). France was also down 0.1%, but Germany and Italy managed growth of 0.3%, and Spain 0.6% – the same as the UK.

Just to ram the point home, here is a chart comparing UK and Irish GDP per capita over time.
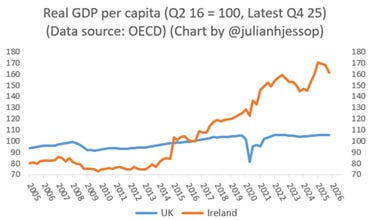
It should not take more than a moment’s thought (or just googling “Leprechaun Economics”) to realise that this is telling us nothing useful about Brexit. But this did not stop the New Statesman from running a particularly daft piece in 2023 titled “Ireland booms while Brexit Britain whimpers next door”, which was widely shared by all the usual suspects…
Ps. you can follow me on X (formerly Twitter) @julianhjessop and on Bluesky.

Julian
Re. W/C 31 May commentary – very good, concise, illuminating valuable service.
Re. Roggoff: IMF intervention likely – (Sunday Telegraph report 7 June 2026 ) – please comment next week.
Roger Brookhouse ________________________________
LikeLiked by 1 person