
The claim that Brexit has already shrunk the UK economy by “as much as 8%” is based on flawed analysis and should not be relied upon – especially as an argument for rejoining the EU.
This blog looks again at one of the most common ways of estimating the “economic damage” allegedly done by Brexit, which also happens to be the one that comes up with the largest and least plausible numbers. This method involves constructing a control group of other countries, often described as a “doppelgänger”. But just like the apparitions in German folklore, these mimics cannot be trusted.
The method explained
Quantifying the impact of Brexit on the UK economy is not easy. Among other challenges, any assessment requires a judgement about what would have happened if the UK had remained in the EU. In other words, what is the “counterfactual”?
Many studies have attempted to solve this problem by comparing the performance of the UK economy since the vote to leave in 2016 with that of a weighted average of other countries. Crucially, these studies then attribute any divergence solely to Brexit. (Alarm bells should already be ringing here!)
In particular, this is how the authors of a working paper published by the NBER last November arrived at their estimate that UK GDP per capita was 8% lower by 2025 than it would have been without Brexit. That figure has since been widely quoted, including by Chancellor Rachel Reeves in her Mais Lecture in March.
Many supporters of rejoining the EU continue to cite the 8% figure as an established fact. In reality, it does not stand up to serious scrutiny.
So, where does it come from?
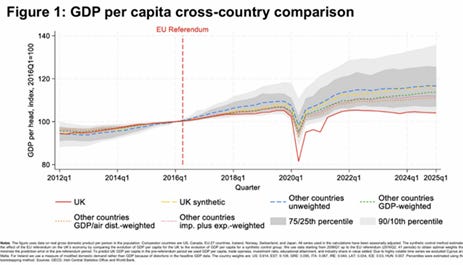
The NBER paper used data for 33 advanced economies (the EU27, the US, Canada, Japan, Iceland, Norway, and Switzerland) from 2006 to 2025, applying five different approaches. Four used data from all 33 economies, taking a simple unweighted average, a GDP‑weighted average, a gravity‑weighted average (GDP divided by distance), and a trade‑weighted average.
The fifth approach used a formal “synthetic control model”. This is the most sophisticated version of a “doppelgänger”, where a computer algorithm is left to pick the weighted average of a subset of countries whose economic performance happened to match that of the UK most closely before 2016.
(It does makes sense to start the clock in early 2016, even though the UK was still a full member of the EU until 2020, because the vote to leave on 23 June 2016 was itself a shock to the economy and the financial markets.)
The results are summarised in the figure below. Note that the 8% figure is simply the average of the wide range of results derived using the five different approaches.
This synthetic control model is also the basis of analysis published more recently by the Resolution Foundation, which updated earlier work by John Springford at the CER.
The Resolution Foundation suggested a hit to GDP per capita of anywhere between 4.3% and 10.4%, depending on the weight given to other variables in selecting the control group. (Again, note the wide range of estimates, which underlines the spurious accuracy of this approach.)

There is a lot to unpick here, but the remainder of this blog will focus on three of the biggest problems with doppelgängers.
Problem 1: Brexit is not the only thing that has happened since 2016
The first problem is the assumption that any divergence in economic performance between the UK and other countries since 2016 can only be due to the decision to leave the EU. Indeed, the authors of the NBER paper acknowledged this problem themselves, both in their original paper and here:
“The underlying assumption is that the UK would have performed as well as some average of other countries in the absence of Brexit. But this might not be true. The Covid‑19 pandemic and the energy shock affected countries differently; policy responses, including the UK’s furlough scheme and subsidy to household energy bills, also varied.”
For this reason, the NBER paper also offered an alternative approach based on micro-modelling (see the postscript at the end of this blog). However, this “underlying assumption” is actually a fatal flaw. The doppelgänger approach simply cannot separate out the impact of Brexit from the myriad of other factors that might explain why some economies have grown more quickly (or slowly) than the UK since 2016.
For example, the US has benefited not just from relatively low energy but also from a large fiscal stimulus and the AI boom. There is therefore a strong case for excluding it from the control group (especially if that group is GDP weighted).
Care should be taken too when comparing the UK’s economic performance since 2016 to that of countries hit hard by the euro area debt crisis of the early 2010s. The numbers for Italy, Spain and Greece in particular have been flattered by catch-up growth.
Ireland’s GDP data should really not be used at all, because they are heavily distorted by the activities of the large multinational companies which started to book their activities there in 2015.
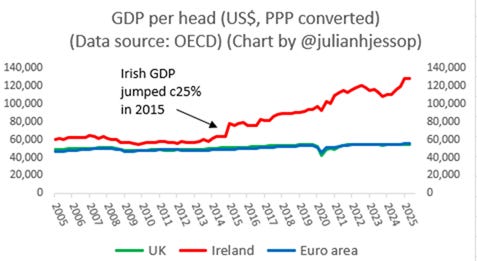
No-one with a basic grasp of economics would suggest that the UK has fallen this far behind Ireland because of Brexit. But this did not stop the New Statesmen from running a piece in 2023 titled “Ireland booms while Brexit Britain whimpers next door”, which was widely shared by all the usual suspects.
Problem 2: comparing the UK to individual countries adds more value than just looking at averages of many countries
This leads on to the second problem.
Comparing the performance of just one country (the UK) to an average of many others is bound to gloss over all the alternative explanations for the differences. This approach also makes it easier to produce charts that make “Brexit Britain” look like the outlier.
A more balanced view would look too at the performance of the UK economy compared to individual countries – especially those that might have been expected to perform similarly in the circumstances of the last ten years (not just in the ten before that).
Supporters of the doppelgänger approach, and especially the use of synthetic control models, argue that these techniques minimise the problem of “cherry-picking” countries to fit a particular narrative. They are also widely used in other contexts.
But there is a trade-off here. There must be some role for judgement when it is obvious that other factors are at play. Indeed, there is a risk that leaning too much on computer models, or averages of as many as 33 very diverse economies, will stifle any intellectual curiosity.
This is particularly the case if you rely on a computer algorithm to do the thinking for you. Here, for example, are the weights in the NBER’s synthetic control model.
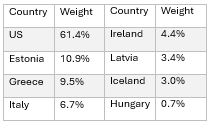
This group is a strange mix. It is dominated by the US (clearly an outlier), with the rest of the basket mainly comprising Italy and Greece (benefiting from catch up growth) and handful of much smaller countries with special features of their own. The inclusion of Ireland is particularly iffy, though the NBER paper does at least use a measure of modified domestic demand for this economy, rather than headline GDP.
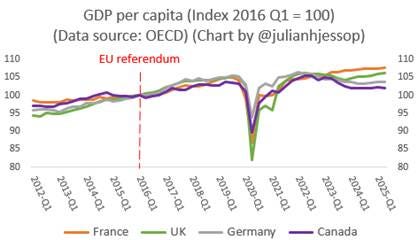
Below then is a variation of the NBER chart which focuses on just five countries. This confirms that the real outlier over this period was the US, not the UK. In GDP per capita terms, “Brexit Britain” has marginally underperformed France and marginally outperformed Germany. There is no sign of an ‘8%’ hit here. What’s more, Canada was the G7 laggard, not the UK.
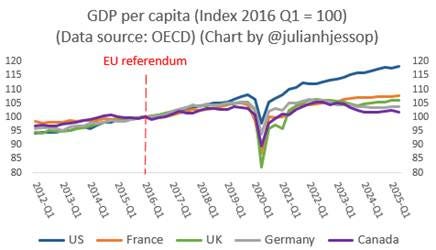
This is perhaps even clearer if you exclude the US from the picture.
This in turn raises a lot of interesting questions that a doppelgänger simply cannot answer.
For example, perhaps the UK’s apparently poor performance on GDP per capita has had far more to do with the UK’s relatively high energy costs and the EV transition. This also explains why Germany has underperformed, especially against France. Relatively high levels of net immigration may have played a part too, as they have in Canada.
Alas, many people are happy just to assume that everything is due to Brexit.
Problem 3: a hit of “as much as 8%” is implausibly large
The third problem is that the 8% figure fails a simple “smell test”.
A hit this large is certainly hard to square with the actual data on business investment (which is recovering as the initial uncertainty has faded) or the UK’s performance on global trade (which has been better than expected).
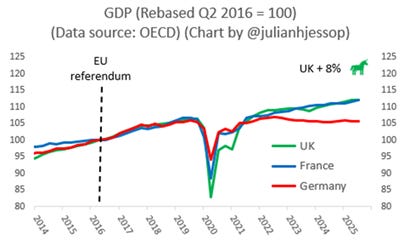
At the top level, the UK economy has grown by about 12% since 2016, outpacing Japan, Germany, Italy and France. If you add another 8% the UK would have been the fastest growing economy in the G7 – bar only the US – and left its EU peers far behind. This is not impossible, given the UK’s rapid population growth, but it is unlikely.

This next chart makes the point in a different way, focusing on just France and Germany. The “green unicorn” shows where the UK would have been if continued EU membership had magically added another 8% to GDP.
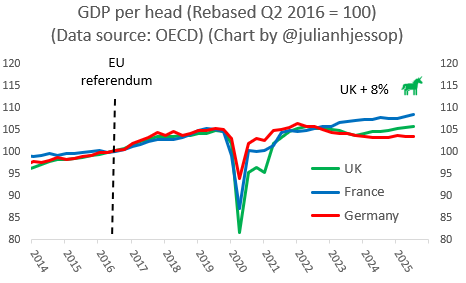
To be fair, the NBER analysis looked at GDP per capita, rather than headline GDP. But here is the same chart showing what an 8% uplift might have looked like on this basis. This is still quite a stretch.
Conclusions
In short, the evidence that Brexit has shrunk the UK economy by “as much as 8%” is remarkably thin. Unfortunately, as Graham Gudgin has noted in another debunking of the NBER paper, most academics are opposed to Brexit (for whatever reason) and few have bothered to contest the existing research, or have felt unable to do so because of peer pressure..
This is not to suggest that there were no negative effects from Brexit whatsoever. The additional uncertainty and frictions have caused some initial disruption to labour markets, business investment, and trade.
But these upfront costs have been much smaller than feared and, more importantly, they are likely to fade over time. In contrast, the benefits of Brexit should continue to build – if the government is willing to take more advantage of them.
Postscript (added 3 May) The NBER paper also suggested that Brexit has reduced UK GDP by 6% (rather than 8%) using an alternative approach based on micro-modelling. This drew on firm-level survey data from the Bank of England’s Decision Maker Panel (DMP) survey. Any divergence in the performance of firms based on their pre-referendum exposure to the EU was then assumed to be due solely to Brexit.
The DMP is a relatively large survey, but the respondents are not necessarily representative of the UK economy as a whole. More importantly, divergences in the performance of individual firms depending on their exposure to the EU may simply be picking up the relative weakness of major European economies over this period (especially Germany), or other factors such as the impact of the UK’s relatively high energy costs on the competitiveness of goods which are mainly exported to the EU.
Finally, while the prospect of an increase in trade frictions with the EU will clearly have had some negative effects, these should prove to be (mostly) temporary as Brexit uncertainty fades and firms adjust to the new trading arrangements. Indeed, the DMP itself suggests that Brexit has dropped well down the list of concerns for most firms. Moreover, the latest Deloitte survey suggests that CFOs are now more worried about “economic weakness in the euro area and the possibility of a renewed euro crisis” than they are about the “effects of Brexit or a deterioration in UK-EU relations”.
You can follow me on X (formerly Twitter) @julianhjessop and on BlueSky.
I also post regularly on Substack.

What would the result be of substituting (say) Germany for the UK, in the same calculation algorithm ?
It seems to me this could be a good method of showing up the problems with the NBER doppelganger model, because Germany will likely come out worse affected by Brexit than the UK.
I suppose the problem is, the Brexit side does not have the resources to do such exercises, or does it ?
LikeLiked by 1 person
Good question! I’ve done this in a crude way here… https://x.com/julianHjessop/status/2051616142657978455?s=20
LikeLike