
Many people have asked me about this chart, which appeared in David Smith’s regular (and usually excellent) column in the Sunday Times this weekend.
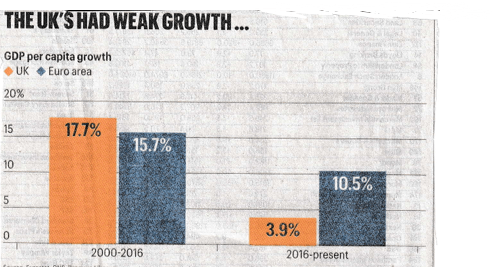
The chart shows that GDP per head has grown much faster since 2016 in the euro area than it has in the UK – ‘nearly three times as fast’, according to Smith. Others have suggested that this “lays bare the full cost of Brexit”. But I’m not so sure.
It is correct to say that the UK has significantly underperformed the euro area on this measure since 2016, after marginally outperforming in the period between 2000 and 2016.
However, this begs the question of why the UK has struggled. Here it is much more insightful to compare the performance of the UK with those of individual countries and to cast the net wider to include all the G7 group of major advanced economies.
Here then is my alternative to the Sunday Times’ chart.
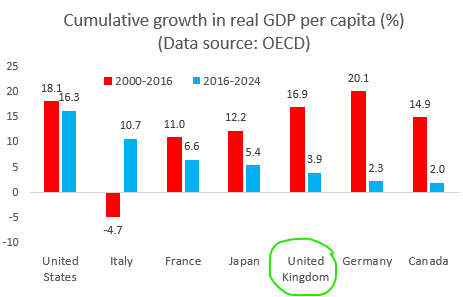
The precise numbers vary according to the source. But using some internationally comparable data from the OECD, UK GDP per head grew by a total of just 4pc in the eight years between 2016 and 2024, compared to 17pc in the sixteen years between 2000 and 2016.
So far, so bad.
Nonetheless, only one G7 economy was able to maintain consistently strong growth in GDP per head across these two periods – and that was the United States. It is surely more useful to ask what has gone right there, rather than focusing exclusively on re-aligning Britain with the European Union.
This is especially important when talking about regulatory alignment. IMF research (cited here by Mario Draghi and included here) has found that the EU’s internal barriers and regulations are equivalent to a tariff of 44% for manufacturing – compared to just 15% in the US – and as high as 110% for services.
Admittedly, the exceptional US performance has also been flattered by factors which are not easily replicable elsewhere. Some are not even sustainable in the US – notably the large budget deficits underpinned by previously strong international appetite for dollar assets. But just comparing headline numbers misses these factors too.
Within Europe, the standout performer since 2016 is Italy, which has recorded the second highest growth in GDP per head in the G7 (behind only the US).
But this rebound must be viewed in context, as the Italian economy barely grew at all during the first decade after adopting the euro in 1999. Italy’s recent impressive performance has also been flattered by a construction and renovation boom, fuelled by tax breaks and other subsidies. That stimulus is fading fast.
France serves as a more suitable benchmark for the UK and has also outperformed ‘Brexit Britain’ since 2016, albeit by much less than Italy. This outperformance can partly be explained by France’s adoption of more business-friendly tax and regulatory policies, and the advantage of relatively cheap and reliable supplies of energy. But France’s public finances are in an even worse state than those in the UK, so this Gallic exceptionalism may not last long either.
Those relying on GDP per head as a measure of the impact of Brexit then have to gloss over Germany’s even worse performance. Since 2016, Germany’s GDP per head has grown by barely 2pc, compared to 20pc in the period between 2000 and 2016. Was that also due to Brexit? Of course not…
Common factors between the UK and Germany include the difficult transition to electric vehicles, relatively high energy costs, and policy choices regarding non-EU migration.
But perhaps the most interesting comparison is with Canada, where growth in GDP per head since 2016 has been roughly half the pace in the UK, and the weakest in the G7.
It cannot be a coincidence that Canada has experienced the highest population growth in the G7 over this period, as successive governments have encouraged immigration to address labour shortages. Does that sound familiar?
Indeed, this exposes one limitation of using GDP per head as a measure of underlying economic performance. This assumes that population growth might be expected to translate one for one into growth in output, income and expenditure, so it then makes sense to adjust for that.
But this still depends on what is driving the increase in the population. Imagine a scenario where population growth reflects a high birth rate. The population may then increase, but the working population might not. GDP per head could then decrease simply because the same amount of income is shared among more people, but this does not necessarily mean that the economy itself has become less productive.
Of course, the recent rapid growth in the UK population has been driven by net migration, not more births. But if a larger proportion of new immigrants are students or dependents, GDP per head could still be lower. And this is in addition to the risk that overreliance on cheap labour from abroad can trap an economy in a low-wage, low-productivity equilibrium.
To save people asking again, I do think Brexit has had some negative effects on UK GDP – notably the drag on business investment from the prolonged uncertainty and the disruption to trade. David Smith is absolutely right to draw attention to these. But in my view, these effects are far smaller than many claim, and more likely to be temporary.
Moreover, just comparing UK and euro zone per capita GDP growth pre- and post-2016, and then attributing the gap to Brexit, misses all the nuances I’ve explained above – as well as many others.
Ps. sources differ on the precise numbers for GDP per head. I’ve backed mine out from the OECD data on annual GDP per capita (US $, volume, constant PPPs, reference year 2020), available here.
