
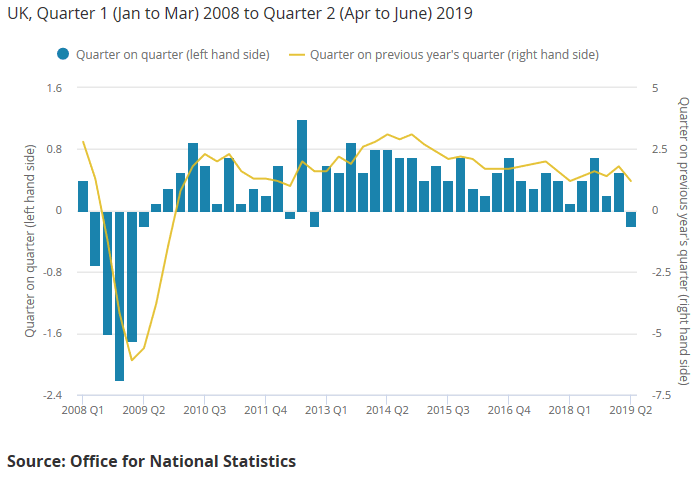
To begin with, let’s be clear that the UK’s second quarter GDP data were disappointing. The 0.2% quarter-on-quarter (q/q) fall was the first decline since 2012, and also bigger than expected (the consensus forecast was for no change). What’s more, the UK was, at the time, the only major economy to report an outright fall in GDP in Q2. (Germany subsequently reported a contraction of 0.1% q/q.)
Nonetheless, it is important to look beyond the headlines and put the Q2 data in context. Crucially, the figures were heavily distorted by the timing of the original Brexit date of 31st March. This affected the numbers in two main ways.
First, a significant amount of activity that would otherwise have taken place in Q2 was brought forward to Q1. Businesses sought to protect themselves against any potential disruption in the event of no deal, especially to cross-border supply chains, by adding to stocks of imported goods in Q1 and, probably to a lesser extent, exporting more in Q1 too. This led to huge quarterly swings in both stockbuilding and net trade (exports minus imports).
In principle, the simple act of stockpiling a good imported from abroad has no net effect on GDP (the increase in stocks is offset by the increase in imports). But this assumes that both stocks and imports are measured correctly, and that no value is added elsewhere in the process.
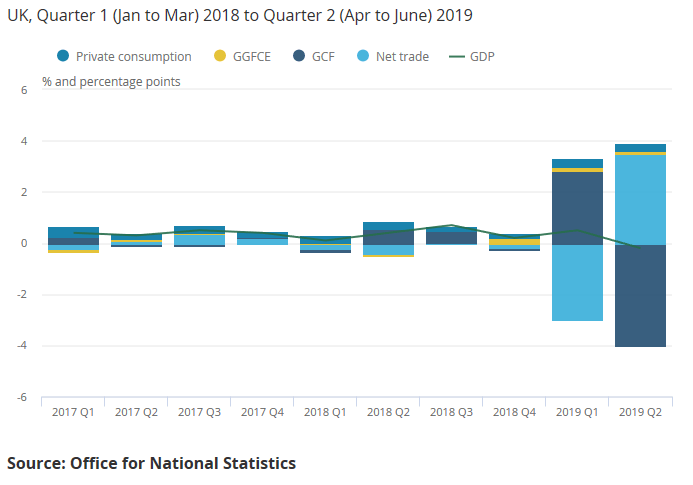
To underline the importance of all this, the chart below shows the contributions of net trade and GCF (gross capital formation, which includes stockbuilding). GCF added 2.8 percentage points (pp) to quarterly growth in Q1 but subtracted 4.0 pp in Q2. On the other hand, net trade subtracted 3.0 pp in Q1 but added 3.5 pp in Q2. Obviously there were other things going on in the economy too, but the relatively small changes in total GDP were dominated by the differences between these relatively large numbers.
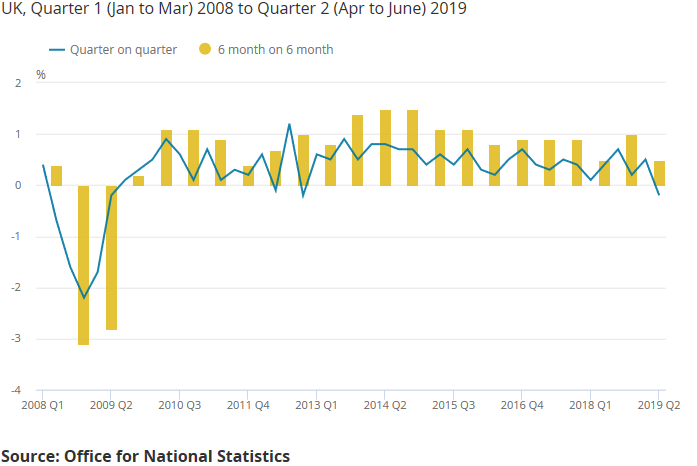
This exceptional volatility makes the individual data for both Q1 and Q2 particularly unreliable. Indeed, it wouldn’t be a surprise to see some big revisions later. It also makes sense to take the Q1 and Q2 data together. On that basis, UK GDP still rose by 0.5% in the first half of the year, as shown in the yellow bars in the chart below. It’s therefore plain daft to claim that Brexit has ‘crashed’ the economy.
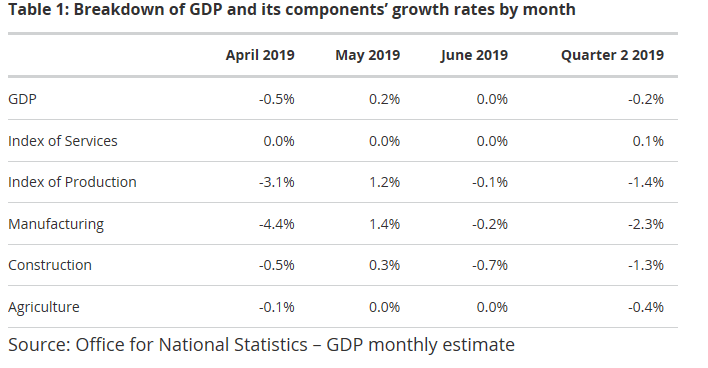
Second, while June was weaker than expected, all of the fall in Q2 GDP (and more) came in the single month of April, when GDP dropped by 0.5%. (See table below.) This was mainly due to the temporary shutdowns in the auto sector, which were, in part, brought forward from the summer. At least some of this lost activity should therefore be recouped, most likely in August, when some car factories remain open when they would otherwise have been closed. (Note all these data are seasonally adjusted, so they should only be affected by things that do not normally happen at a particular time every year.)
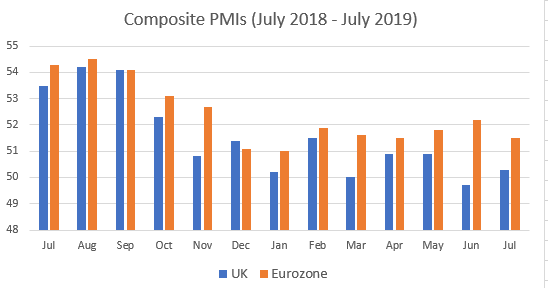
This monthly pattern is one important reason not to expect a second successive quarterly fall in GDP in Q3 (a popular, if flawed, definition of ‘recession’). The latest business surveys, such as the PMIs, also suggest that the UK economy has regained a little momentum at the start of Q3 – or at least stabilised – helped in part by the weakness of sterling. The UK composite PMI is still lagging a bit behind the euro zone as a whole, but the gap has closed slightly.
In addition, the same timing effects that boosted activity in Q1 may do so again in Q3. Admittedly, many firms will still have some unsold stock from Q1 and will not need to add as much again. The rescheduled exit date also falls on 31st October, i.e. one month into Q4, rather than 31st March, which was of course the end of Q1. But it is still possible that UK firms will seek to bring exports forward again, just in case.
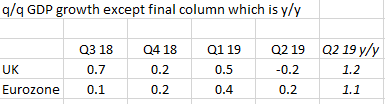
Finally, it’s worth noting that the UK has still matched, or beaten, the growth rate in the euro zone in three of the last four quarters. As a result, the UK’s y/y growth rate of 1.2% in Q2 was actually a tick better than the euro zone’s 1.1%.
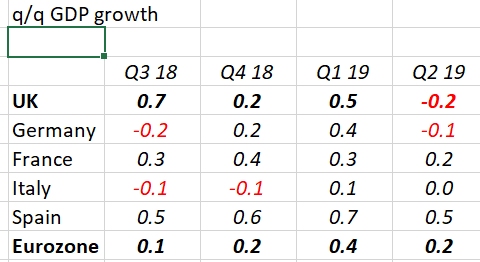
If you look at individual countries, both Germany and Italy have seen their GDP fall in two of the last four quarters. In particular, German GDP was only 0.4% higher in Q2 compared to a year earlier (recall the equivalent UK figure was 1.2%), and the forward-looking business surveys there are dire. (See this tweet thread for more on Germany specifically.)
In summary, the 0.2% fall in GDP in Q2 was largely ‘payback’ for the strength in Q1, when GDP jumped by 0.5%. Brexit uncertainty was indeed to blame for the shift in activity from Q2 to Q1, but it would be wrong to conclude from Q2’s data alone that uncertainty is getting worse. Q3 will probably also see a return to growth.
By the way, my friends at NIESR are predicting growth of 0.2% q/q for Q3. That would only require monthly growth to average 0.1% (the same as the first six months of the year), which seems cautious to me. Instead, chuck in just one 0.2% monthly gain (perhaps in August), and Q3 would be 0.3% q/q. Indeed, the risks might still be on the upside if activity is brought forward, once again, ahead of an expected Brexit date in Q4. Obviously none of these are great numbers, but still no recession.
Of course, this doesn’t tell us much, if anything, about what happens in Q4 and beyond. There is no doubt that the level of UK GDP is lower than it would otherwise have been (perhaps 1-1.5% lower) as a result of the needlessly prolonged uncertainty since the 2016 referendum. In particular, business investment has stalled, as the chart below shows.

The outlook for investment is therefore crucial, and I’ll return to it soon in another blog. But in brief, as long as the worst case scenarios are avoided, business investment should pick up again once the UK actually leaves the EU and the uncertainty is reduced. In the meantime, one quarter’s 0.2% decline in GDP is no reason to change tack on Brexit.
(This blog was originally published on 9th August, then updated on 14th August to include the latest German data.)
