
There is a lively debate among economists about the way in which UK statisticians are estimating the impact of Covid and the lockdown on the output of the public sector. This is a relatively arcane topic and the mainstream media can be forgiven for not yet covering it. But it is important, not least because other countries do things differently.
If we adjust for this, the fall in UK GDP in the first half of the year would probably be closer to that in France and Italy, rather than the outlier that the headlines suggest. On the other hand, the UK method is more accurate,
These issues have also led to some confusion about an alternative measure of inflation known as the implied GDP deflator, prompting Shaun Richards to ask “Has nobody else spotted 6% inflation being reported in UK GDP?“. That’s where I’ll begin…
The GDP deflator is an index which can be used to convert nominal data into real data, or cash spending into the volume of goods and services actually bought. Implicit deflators can be calculated by dividing an aggregate measured in current prices by the same aggregate measured in constant prices.
In normal times, nominal GDP might rise by 4% and real GDP by 2%, with the difference being an increase in prices of about 2%. Changes in the GDP deflator are therefore usually seen as a measure of general inflation, as Shaun suggested. Indeed, the ONS itself describes the implied GDP deflator as ‘the broadest measure of inflation in the domestic economy, reflecting changes in the price of all goods and services that comprise GDP’.
It is therefore striking that the GDP deflator jumped by 6.2% quarter-on-quarter (q/q) in the second quarter, and was 7.9% higher than the same quarter a year earlier (y/y). What’s more, the UK was the only major economy to report such a large increase.

However, it would be misleading to interpret this change as ‘inflation’ in the normal sense, and equally unhelpful to compare it directly to the more familiar consumer price index, or CPI.
For a start, the GDP deflator covers the whole of the economy, not just consumer spending. If you are looking for an ‘inflation’ measure to compare to the CPI, it makes more sense to use the deflator for ‘household consumption expenditure’. This was little changed in Q2 (-0.1% y/y, compared to an average of +0.6% for the CPI).

Instead, the big mover in Q2 was the deflator for ‘government consumption expenditure’, which jumped by 32.7% q/q and more than 40% y/y. In the words again of the ONS ‘this notable increase occurred because the volume of government activity fell while at the same time government expenditure increased in nominal terms.’

So, what’s behind this? Doubtless part of this is genuine inflation – notably the much higher prices that the UK government paid for PPE. But another factor appears to be more important, namely the way in which the UK statisticians measure the output of the public sector.
The short point is that UK statisticians have put a lot more effort into estimating how much activity actually took place in sectors such as public health and education. In contrast, statisticians in other countries have based their estimates here on the fact that staff costs and other bills were still being paid as usual.
I believe the UK approach is the right one. If you think that GDP should be a measure of economic activity, or value-added, or contribution to wellbeing, the fact that schools are at least partially closed and that hospitals are treating fewer people must be relevant. The standard assumption that output can be proxied by inputs is surely wrong in these circumstances.
Similarly, if a shop were only selling half as many goods as usual due to the pandemic, you’d expect its contribution to GDP to be marked down, even if it were still paying its staff in full.
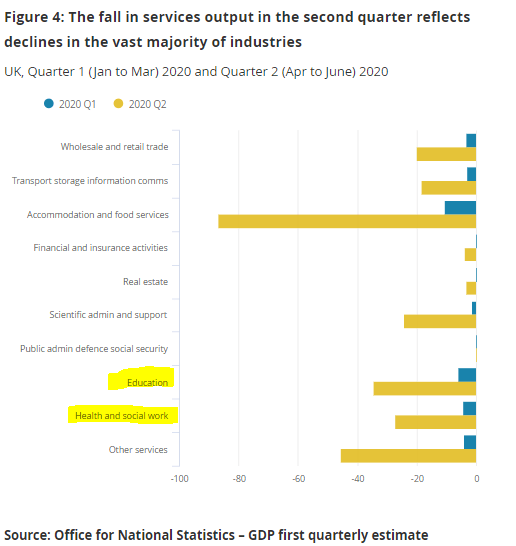
Nonetheless, there are some valid concerns about the size of the adjustments that the ONS has made. According to the official UK numbers, the output of the education sector (both public and private) collapsed by 34% q/q in Q2, and health by 27%. Together, these changes reduced GDP by about 4%.
Within government, total spending rose by 14.1% q/q in cash terms, but the volume of goods and services that this spending paid for was assumed to fall by 14.0%. The huge difference between the two is the implied deflator of 32.7% for government spending (trust me on the maths, but 114.1/86.0=1.327).
Note again this is not inflation in the usual sense of rising prices: it does not mean, for example, that the cost of providing an individual school lesson or an operation in a hospital has risen (though that may also be true in some cases). Instead it is a reflection of hospitals and schools doing less work during the pandemic. In volume terms, the ONS has estimated that government healthcare consumption fell by 30% in Q2, while education fell by 25%.
Andrew Sentence has quite rightly questioned whether these numbers are plausible, especially the divergence between a large increase in cash spending and the large fall in the volume of output. Andrew has suggested that the ONS may not have made enough allowance for health and education services being provided differently in the lockdown, including online. In addition, the pandemic has not had much impact on the output of other large parts of government, such as the civil service and armed forces.
My own view, though, is that the ONS numbers are at least in the right ballpark. It seems perfectly plausible that the amount of ‘education’ that children received fell by about a third in the second quarter of the year. Online teaching has filled some of the gaps, but coverage is patchy: one study found that children locked down at home in the UK spend an average of just 2.5 hours each day on schoolwork, with many (particularly in state schools and in poorer areas) doing significantly less. Children are also still missing the personal contact with teachers and their friends, and all the social and sporting activities that are part and parcel of normal school life.
Further education colleges and universities have provided a significantly reduced service too.
In the NHS, the numbers of ‘elective’ (non-emergency) operations, A&E admissions and regular GP appointments all fell sharply in Q2. There is particular concern about the number of cancer patients who may be missing treatment. Obviously, many staff and resources were diverted to deal with the pandemic and this needs to be recognised when measuring the output of a service whose role is to protect the nation’s health.
But the NHS employs more than 1.7 million people in total and 1.5 million on a full-time equivalent basis, representing about a third of total public sector employment. Only some of them have actually been fighting Covid. Another million or so work in state education.

I’m also happy to accept that the ONS has made a decent attempt at allowing for the different ways in which health and education services have been provided in the lockdown. For example, the estimates for education output take account of remote learning by making use of survey data, adjusted for teachers hours and parental input (explained further in a note published in May).
And it’s also possible to replicate the ONS estimate that total government spending fell by 14% q/q in real terms, using the weights implied by employment data. If we assume that NHS output fell by a fifth and weight that by the share of NHS employment in total public sector employment (34%), and also assume that education output fell by a third and weight that by its share (24%), this adds up to a fall in total public sector output of just under 15% (0.2*34% + 0.33*24%), even without any change in the output of the rest of the public sector.
In summary, the ONS is right to attempt to measure the actual outputs of the public sector during the pandemic, rather than simply assuming these can be proxied by the value of inputs. It is vital that official data properly reflect the impact of Covid and the lockdown on the wellbeing of children and the health of all.
This may well mean that the UK reports a bigger fall in GDP during the lockdown and a faster recovery when the restrictions are lifted – especially when all children return to school and the NHS starts to catch up on the backlog of non-Covid work. As a result, the official GDP numbers for the third quarter are likely to be even stronger. But this is a more accurate reflection of what is actually happening.
It may also mean that the differences between the official GDP data in the UK and those in other countries have been exaggerated by the differences in the ways in which the numbers are calculated. For example, the German GDP data for the second quarter included an increase in government consumption expenditure of 1.5% q/q, in contrast to the slump of 14% reported in the UK.
If we compare nominal GDP rather than real GDP, the fall in the UK in the first half of the year, while still huge, was about the same as that in France and probably in Italy too (Italy has not yet released comparable data, but the fall in real GDP there was similar to that in France and calculated on a similar basis). And either way, Spain has been the economy worst hit by coronavirus so far, not the UK.

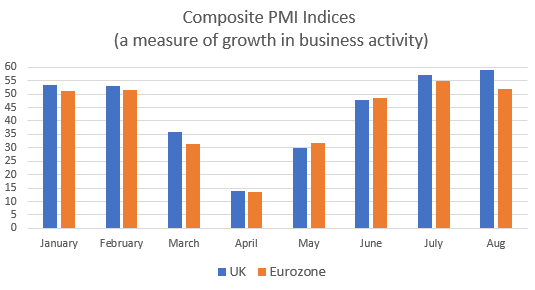
The purchasing managers surveys (which exclude the public sector) also support the view the UK was not the outlier that the GDP numbers might suggest. If anything, the recovery in the UK is gaining momentum even as that in the rest of Europe falters.
Finally, as the ONS also acknowledges, there is more than usual uncertainty in the GDP data and scope for revisions. The statisticians have done a good job in explaining what they have done – and it is not hard to find more detail on the ONS website if you know where to look. But it would be helpful if more people were aware of these issues.
PS. this piece was first published on 22nd August. Since then, David Smith has had a good go at these issues too, and was kind enough to quote me. Mike Haynes has written more as well.

Excellent article. Its amazing that most broadcast economics journalists (even though many did PPE) don’t know this stuff, but then it would spoil their headline I suppose.
LikeLiked by 1 person
Thanks for doing this.
LikeLike
Thank you. Really useful information for my A level Econ students(and me!)
LikeLiked by 1 person
Thanks Cheryl! Do feel free to email (via the contact page) if I can help further. J
LikeLike