
In a thought-provoking blog for the New Economics Foundation (NEF), Alfie Stirling has made the striking claim that the cumulative effect of austerity since 2010 has been to reduce the level of UK GDP in 2018/19 by 4.7%, or almost £100 billion. This is equivalent to “around £1,500 for every woman, man and child this year alone”. The report was picked up enthusiastically by The Independent and The Guardian, the latter including an endorsement from the Shadow Chancellor, John McDonnell.
Alfie Stirling’s piece is indeed passionate and well written. However, there’s actually little new or original here. More importantly, I think the analysis comes up with some seriously misleading numbers. The graphic below is also unhelpful, not least because it implies the hit from (long) past austerity is continually increasing.

Let’s start with what the report actually does. The author has simply added up the estimated impact on GDP of discretionary changes in fiscal policy (tax increases and cuts to government spending) in each year since 2010. As he explains, these figures have already been published by the Office for Budget Responsibility (OBR), based on work by the Institute for Fiscal Studies (IFS).
But to illustrate this further, below is the relevant chart from the OBR’s latest Forecast Evaluation Report (December 2018), which tells the story rather better. The NEF work tots up the yellow bars. Crucially, though, it ignores the blue ones.
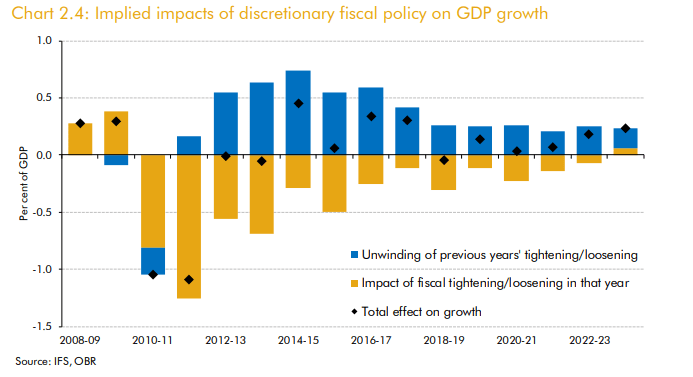
Here it is also worth reading the OBR’s commentary accompanying this chart. The key point is that you can’t just sum the initial hits in each year to gauge the cumulative effect on GDP. This is because the impact of spending cuts and tax increases “unwind over time”. The OBR itself may be going too far in claiming that “fiscal consolidation does not reduce demand in the long term”. (I’d add that it may do significant damage to the supply side too.) But most economists would agree that some, if not all, of the negative impact will eventually be reversed.
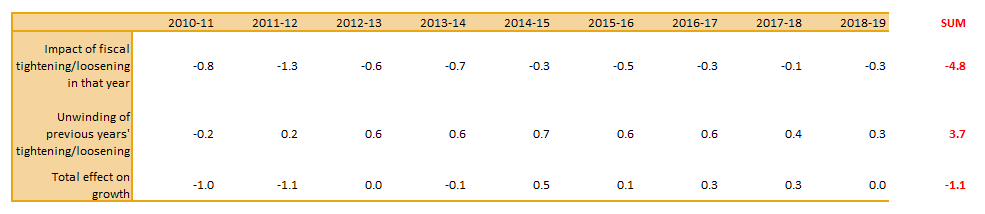
So let’s revisit the NEF calculations. The table below is the data from the OBR report. I’ve added a column at the end which sums each row. As it happens I get -4.8% for the first row, rather than -4.7%, but that might just be due to rounding. More importantly, the cumulative hit falls to 1.1% (or nearer £20bn than £100bn) once the unwinding of previous years’ tightening has been taken into account.
To be fair, Alfie Stirling acknowledges that his numbers do not include any subsequent unwinding; they are the ‘isolated effects’. His defence is that this unwinding largely depends on offsetting monetary stimulus from the Bank of England, which may have been less effective given that interest rates were already close to zero. A broken financial system was unable or unwilling to lend, even if households and businesses wanted to borrow (a textbook ‘liquidity trap’).
This is a reasonable argument, which others have made too. The OBR’s assumptions on the speed and extent of unwinding are shakier than those for the initial impact, so it may well be wrong to treat the two equally and simply add them together. Nonetheless, the original blog could have made it clearer that at least some of the initial impact of austerity measures taken many years ago will already have been reversed. By ‘isolating’ just the first-year impacts, the analysis ignores any effects that are felt with a lag of more than a year. When looking at the impact of austerity measures all the way back to 2010, that’s a significant omission.
Indeed, it is surely wrong to make no allowance whatsoever for the impact of an extended period of exceptionally loose monetary policy, including substantial quantitative easing (QE). This is especially true now, when the economy and financial conditions are healthier and the Bank of England has been able to start to return interest rates towards more normal levels. There may be other potential offsets too, including the ‘crowding in’ of private sector spending and the boost to net trade and inward investment from a lower currency.
Put differently, the NEF report has effectively placed 100% weight on the OBR and IFS estimates of the initial impact of austerity in each year, but 0% weight on the same organisations’ estimates of the unwinding in subsequent years. That’s an obvious inconsistency. If you gave the estimates for the subsequent unwinding a weight of 75%, rather than 0%, you’d arrive at a much smaller figure of 2% of GDP (call it £40bn) for the net impact from 2010 to date.
Of course, that’s still a sizeable hit. However, some would argue that this was the price that had to be paid to fix the public finances, given that the government had been running large deficits throughout the 2000s and was borrowing around 10% of national income in 2010. (You can view the OBR databank here.) Had this action not been taken, interest rates might have surged as markets lost confidence.
That said, I sympathise with the view that the austerity implemented in the early 2010s was too much, too soon. But the NEF is not saying anything new here. That argument was first made by others long ago and, in my view at least, has already been won. Its what economists like Simon Wren-Lewis and Jonathan Portes have been saying consistently for many years.
Even some of those who recommended aggressive fiscal consolidation in 2010 quickly began to change their minds. The IMF in particular revised its estimates of the impact of tax increases and spending cuts on GDP (the so-called ‘fiscal multipliers’) sharply higher in 2012. This is important, because the initial austerity programme in the UK was partly based on the earlier, lower estimates, which had suggested that the pain would be less.
It is also now widely recognised – though perhaps again only with hindsight – that fears of Greek-style debt crisis in the UK were overdone. The mistakes made in the UK were magnified by the coordinated austerity in the euro area. But the UK had at least ignored demands (including from the CBI and the auto sector) to join the euro. This meant that the Bank of England was free to adopt QE well before the European Central Bank, as well as let its own currency fall. In extremis, the UK can print money to avoid bankruptcy in a way that euro members can not.
In addition, by focusing on a single number for the cumulative impact of austerity on 2018/19 (and a misleading number at that), the NEF is ignoring the sea-change that has already happened. Even if you take the NEF numbers at face value, the bulk of the damage was done between 2010-11 and 2013-14. Since then the drag from fiscal consolidation in the UK has dwindled to next to nothing.
This makes the claim that austerity is costing every man, woman or child around £1,500 ‘this year alone’ especially disingenuous. The IFS’s own estimates, quoted by the OBR, suggest that ‘fiscal policy increased GDP growth in 2017-18 by 0.3 percentage points, as the -0.1 percentage point effect of new consolidation in the year is more than offset by the +0.4 percentage point effect of previous years’ consolidation effects unwinding’.
I’m therefore concerned about how some others might interpret the results. It’s one thing to argue that raising taxes and slashing public expenditure is a terrible idea when the economy is only just emerging from a deep recession. Here, few would disagree with Alfie Stirling’s own conclusion that the policy response must be different next time we are in a crisis as deep as that ten years ago. If the lesson from the NEF report is that fiscal policy should allow the ‘automatic stabilisers’ to work properly during economic downturns, you can sign me up too. Alfie Stirling and the NEF are doing their own work on a more sophisticated fiscal policy framework and it will be interesting to see what they come up with.
But in the meantime, there is a danger that the results of Alfie Stirling’s blog are taken as a green light to abandon fiscal discipline now, especially given how these results are presented. People glancing at the NEF graphic showing an ever-widening shortfall between the two paths for GDP might be forgiven for backing a immediate increase in government spending to close the gap.
More generally, if you’re only going to look at the first-year impact, ignoring any second round or lagged effects, fiscal stimulus might always seem a good idea. The reality is that implementing a vast programme of public spending when the UK economy and financial system are now in far better shape could be the mirror image of the mistake that the government made in tightening fiscal policy too soon in the early 2010s.
In summary, a massive fiscal expansion when the economy is operating close to full employment would be the opposite of the sort of sensible ‘counter-cyclical Keynesianism’ that most economists could probably support, whatever their political leanings.
This is an extended version of a piece first published by CapX.
